Operational logs
dak records what it does in a local SQLite store, so you can diagnose a failed call or review what an agent ran. The agent can read the logs through MCP resources, and you can read the file directly.
Where they live
The store is logs.db in a per-user state directory:
| Platform | Directory |
|---|---|
| Windows | %LOCALAPPDATA%\databricks-agent-kit |
| Other systems | $XDG_STATE_HOME/databricks-agent-kit, by default ~/.local/state/databricks-agent-kit |
Set DAK_STORAGE_DIR to use another directory. Every dak process of the same user shares the store. Outside Windows, the directory is 0700 and the file is 0600, so only its owner can read it. Logs written by earlier versions in <install dir>/.storage are not migrated.
Data model
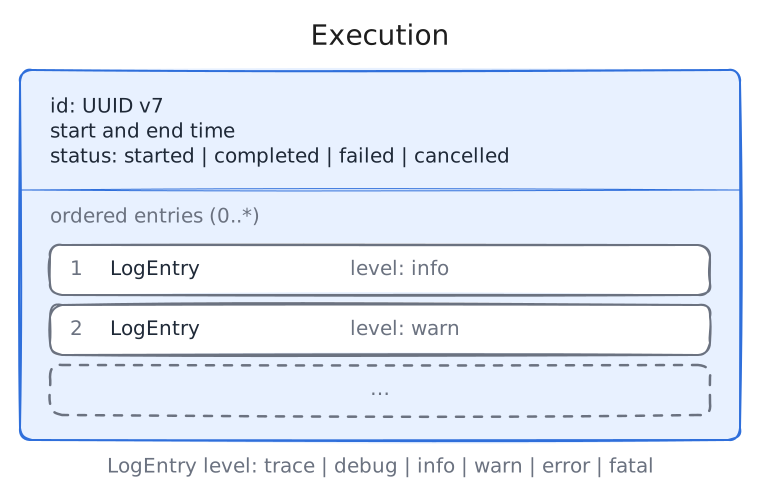
- Every tool call is an execution, with a start and end time, a status and its ordered entries.
- Each export runs as its own execution.
- Server start and stop events belong to a lifecycle execution per process.
- Reading the log resources opens no execution. Diagnosing therefore does not inflate the statistics it reports.
resource://databricks/warehousesis recorded like a tool call.- If the process dies during a call, its execution stays as
started.
What is logged
- One entry per call, written when the call ends at
infolevel: the tool name, its arguments, the duration and a summary of the result (statementId,warehouseId, state, row count,truncated, andcheckMsfor the read-only check). - SQL text is logged and cut at 4096 characters.
- Never logged: parameter values (only their name and type), result rows, tokens or secrets. Keys such as
token,secret,passwordandauthorizationare redacted.
Levels
- An expected failure, a
DakErrorsuch as a read-only violation, an invalid argument,PERMISSION_DENIEDor bad SQL, is onewarnentry without a stack trace. - An unexpected error is one
errorentry with its stack trace. - Retries of Databricks requests and export downloads are
warn. - The automatic warehouse choice, and the start and end of an export, are
info. - Token refreshes, every Databricks request and every written export chunk are
debug. - Repeated
401rejections on the HTTP transport produce onewarnper minute, with a counter.
DAK_LOG_LEVEL (trace, debug, info, warn, error, fatal; default info) filters what is stored.
Writes and retention
Entries go through an in-memory queue. It is flushed every 5 seconds, every 100 events in one transaction, and on shutdown. If the process crashes, only the events still in the queue are lost.
Entries are kept for 90 days. The store is purged at startup and every 24 hours.
Reading the logs through MCP
| Resource | Content |
|---|---|
resource://logs/errors/recent | Latest error and fatal entries |
resource://logs/executions/recent | Latest executions |
resource://logs/execution/{executionId} | One execution with all its entries |
resource://logs/stats | Executions, errors and warnings in the last 24 hours |
There is no log search tool. The log costs no context until an agent reads one of these resources. In HTTP mode, every client sees the calls of every other client, SQL text included.